
News
Blog | 2 min read
October 2, 2020

Each quarter, Greater Richmond Partnership staff collect prices on a variety of products to calculate the C2ER Cost of Living Index for the Greater Richmond region. This index allows for relative cost of living comparisons between metro areas. With a benchmark of 100, a lower the overall score represents a cost of living lower than the national average of metros. 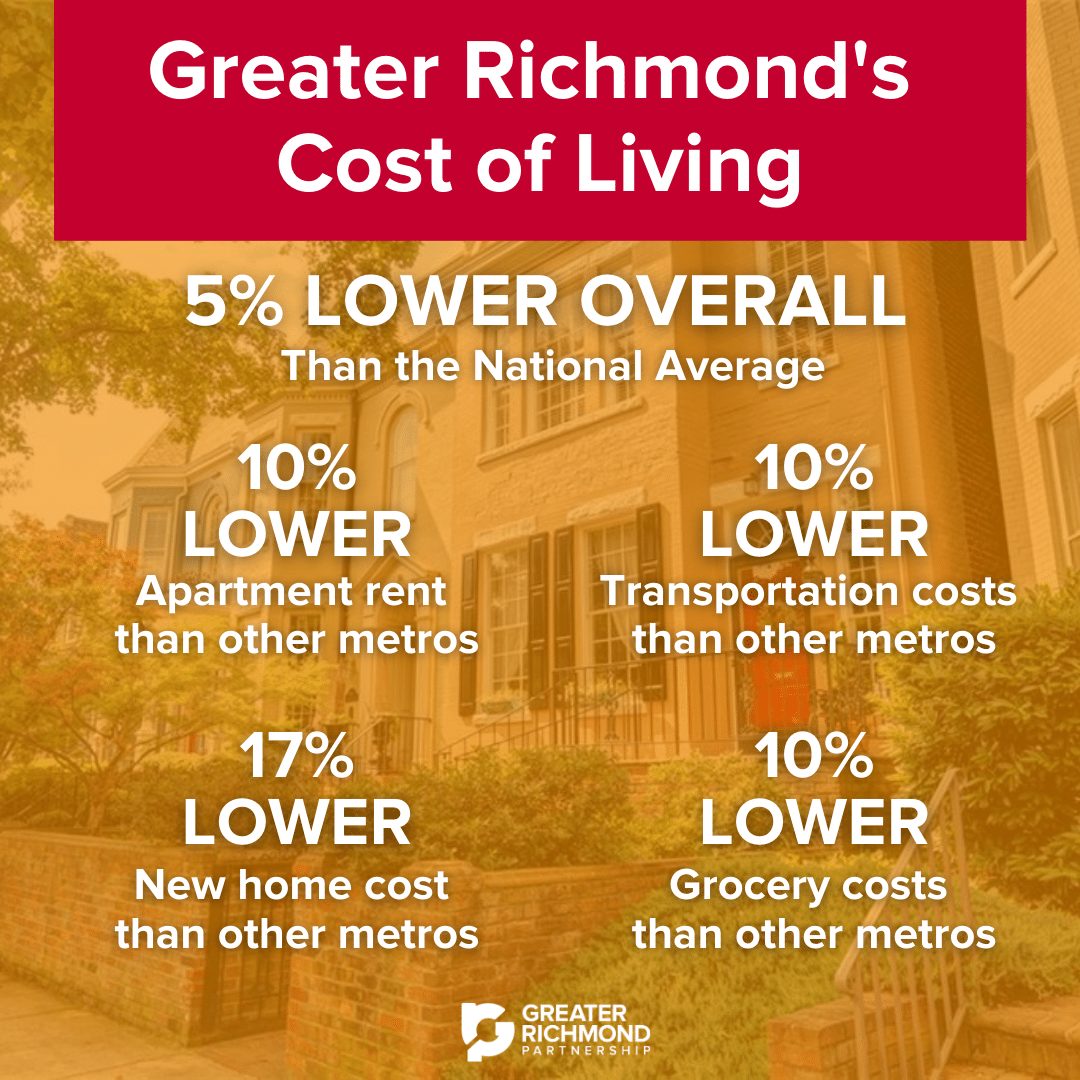
For the last 2 years, the region’s overall index has remained below the national average of 100, sitting around 95 or below. In the most recent quarter, the region’s Cost of Living Index is 94.9, a full 5 percent below the average metro area.
One of the largest drivers of this quarter’s low index is housing costs. The housing portion accounts for 28 percent of the index and includes a 2-bedroom/1.5-bathroom apartment, a new 4-bedroom house, and local mortgage rates. In the last year, apartment rent increased by 2 percent in both the Richmond region and in the U.S. on average. Additionally, the rent for this apartment is 10 percent cheaper in the Richmond Region than the average metro. The cost of a new house increased by 2 percent as well in both Richmond and the U.S. However, the cost of the Richmond-area home is 17 percent below the U.S. average.
The Richmond Region also scores about 10 percent below the national average on two additional categories: Grocery and Transportation.
Small changes in the index between quarters are negligible and the overall cost of living should be determined over multiple quarters. When comparing this data to that of the 2019 averages, there were only slight variations of 3 percent for each category. The only significant change between 2018 and 2019 annual average indexes was a decrease in health care cost in the region.
Calculations for the index comprise of prices for 60 items within six categories: Grocery, Housing, Utilities, Transportation, Health Care, and Miscellaneous Goods and Services. Staff collects data by visiting grocery stores, searching online, and calling local businesses. Once compiled, each region submits their data results to the Council for Community and Economic Research (C2ER) allowing for national comparisons.