News
Blog | 3 min read
June 15, 2026

Regional economic development runs on information, but too often the data that matters most is scattered across sources, inconsistent across geographies or simply hard to pull together quickly. Site consultants, investors and regional partners shouldn’t have to piece it together themselves.
That’s the challenge the Greater Richmond Partnership’s regional data dashboard was built to help solve.
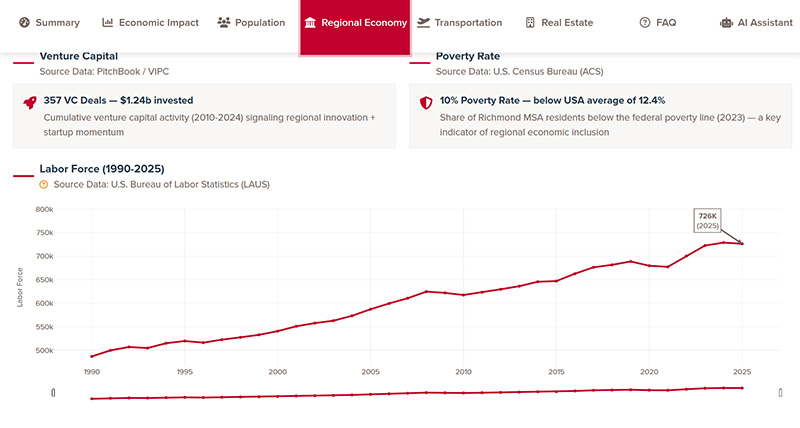
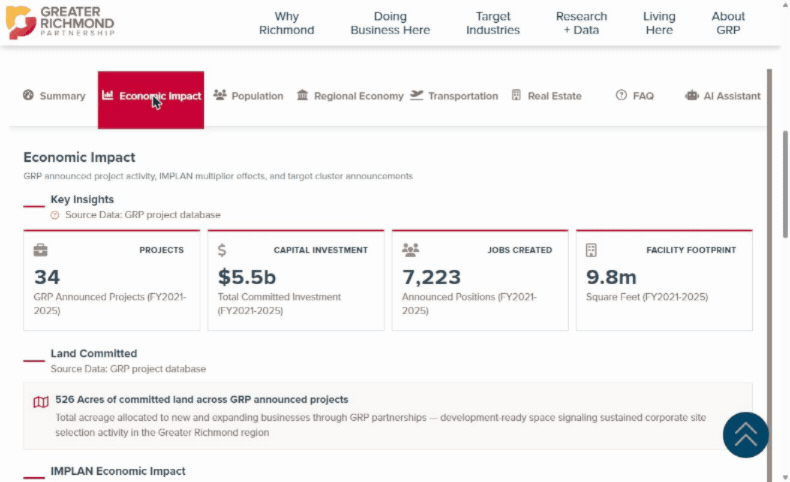
Launched in May 2026, the dashboard brings together 28 indicators across five categories: economic impact, population, regional economy, transportation and real estate, into a single, accessible view of where the Richmond Region stands. It draws from a combination of public and private sources, and where possible, benchmarks the region against U.S. averages. That comparison is intentional: Greater Richmond’s strengths come into clearer focus when set against a national baseline.
The five categories cover the indicators most relevant to business investment decisions and regional competitiveness, including insights to recent data:
Each category is navigable from the summary view and designed to surface the data most in demand, not just headline numbers but the underlying trends that give those numbers meaning. By ensuring the data is accessible and easily digestible, Greater Richmond’s strengths come into clearer focus.
Example:
A few things worth knowing as you explore the dashboard:
The dashboard is a living resource. GRP plans quarterly updates to refresh the data and expand or refine the indicators over time. An accompanying blog post will go out with each update, focused on what the latest numbers show, so this primer is the foundation and the analysis builds from here.
The dashboard also includes a built-in AI tool on the final tab, available to GRP stakeholders for quick queries and ad hoc exploration as you work through the data. The AI tool is password-protected; to request access, reach out to GRP’s research team directly via email.
You can reach out to our research team for questions or access to the AI assistant by e-mailing: [email protected].
About The Author

Joe Kane is the Senior Director of Research at Greater Richmond Partnership, where he leads research initiatives supporting business development and marketing efforts to recruit companies to the Richmond Region. Kane began his career as an economist at the U.S. Department of Labor before spending more than a decade as a fellow at the Brookings Institution in Washington, D.C., building a research portfolio spanning local, state and national economic development issues. His work has been featured in The New York Times, The Wall Street Journal and The Economist. He holds a bachelor’s degree in economics and history from William & Mary and a master’s in urban and environmental planning from the University of Virginia, and teaches as an adjunct professor at Georgetown University.